
海氷面積の時系列推移を確認します。データ出所は National Snow and Ice Data Center https://nsidc.org/ です。
- 本ポストは定期的に更新します。
海氷面積系列は北極域、南極域および全球から構成されています。北極域および南極域の対象エリアは Figure 6 を確認してください。
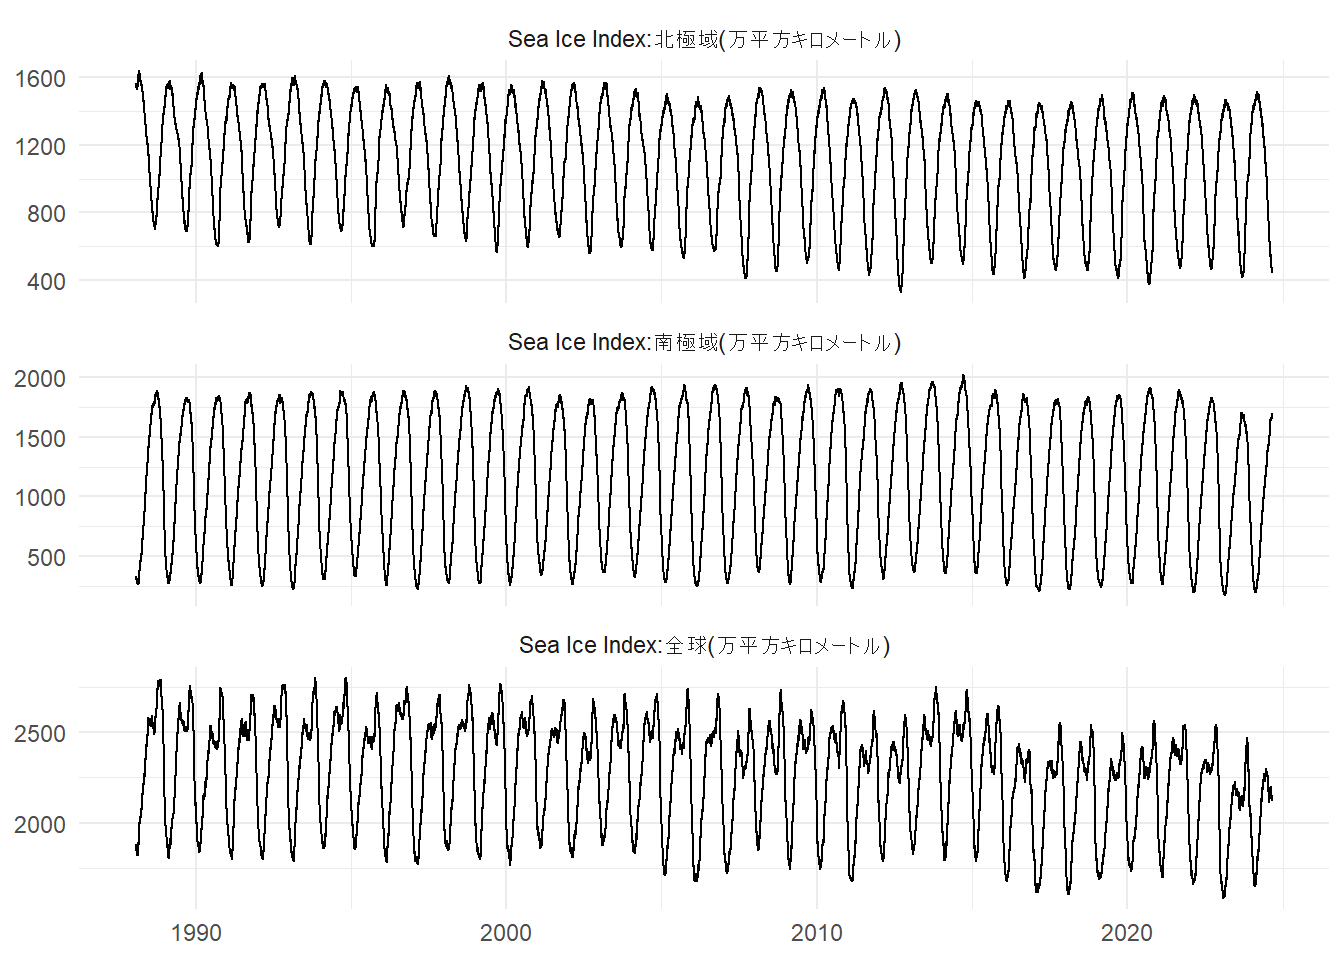
Figure 1 は 1988年02月01日から2024年08月31日 までの北極域、南極域そして全球の日次海氷面積の時系列推移です。北極域および南極域の海氷面積の推移には明確な周期性が確認できます。
なお、Table 1、Table 2 はそれぞれ北極域と南極域の直近5週間の海氷面積の推移です。
| Sea Ice Index:北極域(万平方キロメートル) | |||||||
| Sun | Mon | Tue | Wed | Thu | Fri | Sat | |
|---|---|---|---|---|---|---|---|
1 | 2024-07-28 | 2024-07-29 | 2024-07-30 | 2024-07-31 | 2024-08-01 | 2024-08-02 | 2024-08-03 |
2 | 2024-08-04 | 2024-08-05 | 2024-08-06 | 2024-08-07 | 2024-08-08 | 2024-08-09 | 2024-08-10 |
3 | 2024-08-11 | 2024-08-12 | 2024-08-13 | 2024-08-14 | 2024-08-15 | 2024-08-16 | 2024-08-17 |
4 | 2024-08-18 | 2024-08-19 | 2024-08-20 | 2024-08-21 | 2024-08-22 | 2024-08-23 | 2024-08-24 |
5 | 2024-08-25 | 2024-08-26 | 2024-08-27 | 2024-08-28 | 2024-08-29 | 2024-08-30 | 2024-08-31 |
| Sea Ice Index:南極域(万平方キロメートル) | |||||||
| Sun | Mon | Tue | Wed | Thu | Fri | Sat | |
|---|---|---|---|---|---|---|---|
1 | 2024-07-28 | 2024-07-29 | 2024-07-30 | 2024-07-31 | 2024-08-01 | 2024-08-02 | 2024-08-03 |
2 | 2024-08-04 | 2024-08-05 | 2024-08-06 | 2024-08-07 | 2024-08-08 | 2024-08-09 | 2024-08-10 |
3 | 2024-08-11 | 2024-08-12 | 2024-08-13 | 2024-08-14 | 2024-08-15 | 2024-08-16 | 2024-08-17 |
4 | 2024-08-18 | 2024-08-19 | 2024-08-20 | 2024-08-21 | 2024-08-22 | 2024-08-23 | 2024-08-24 |
5 | 2024-08-25 | 2024-08-26 | 2024-08-27 | 2024-08-28 | 2024-08-29 | 2024-08-30 | 2024-08-31 |
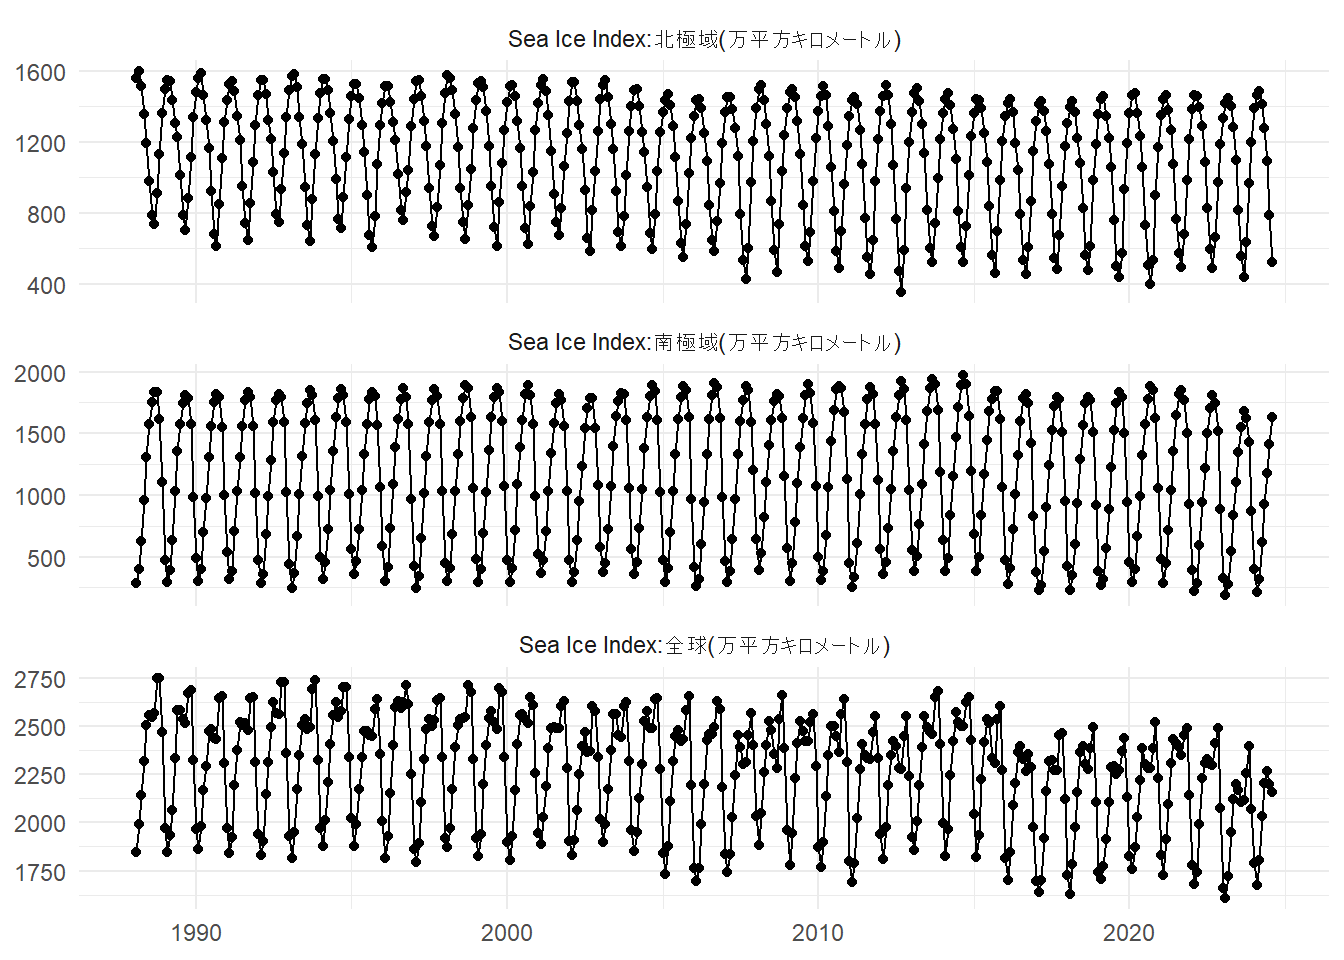
Figure 2 は日次海氷面積の月平均値の時系列推移、対象期間は 1988年02月から2024年08月までです。
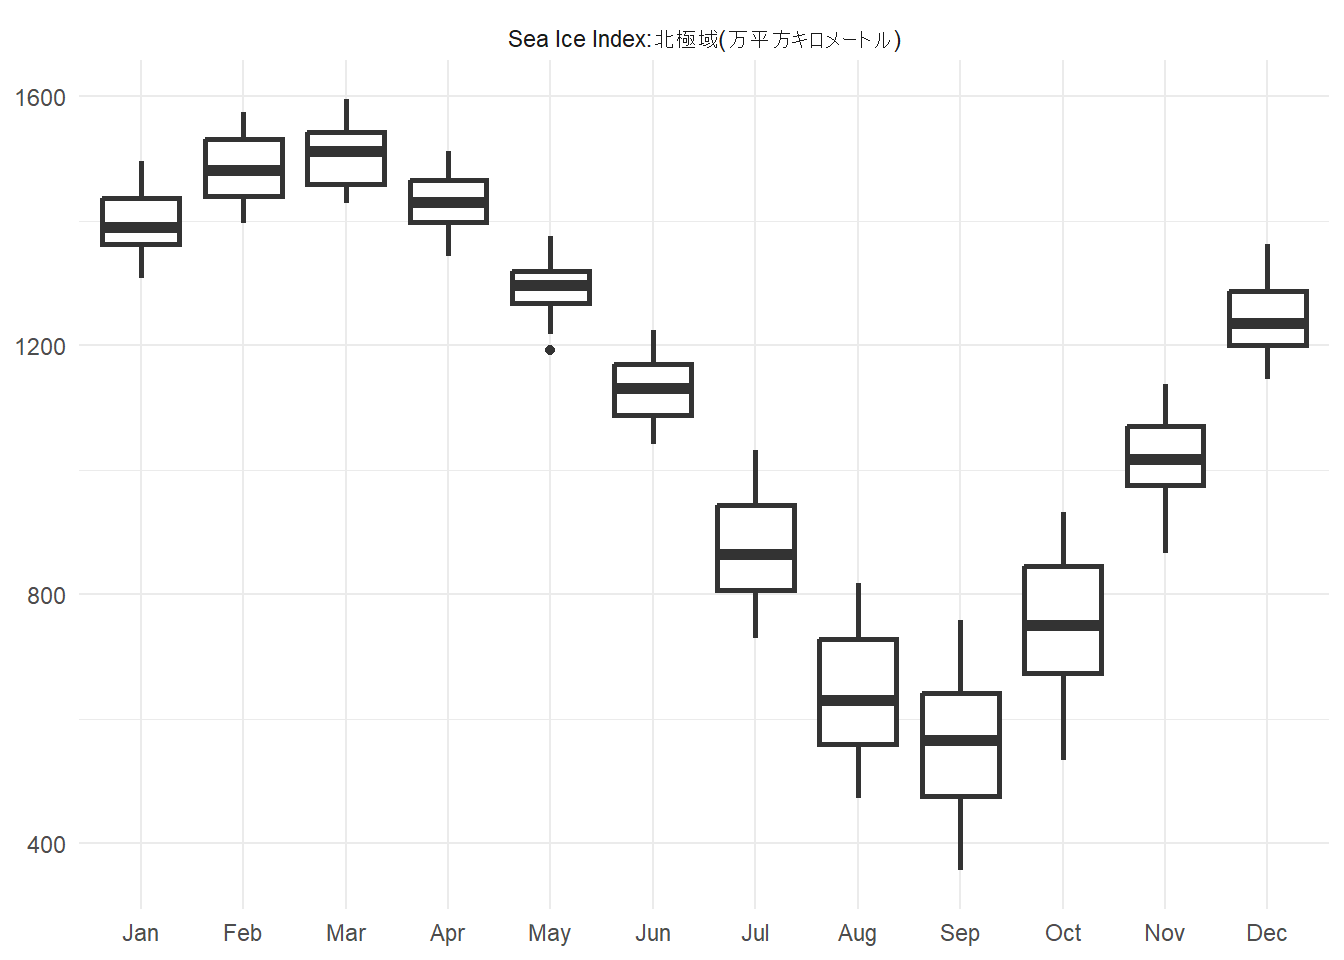
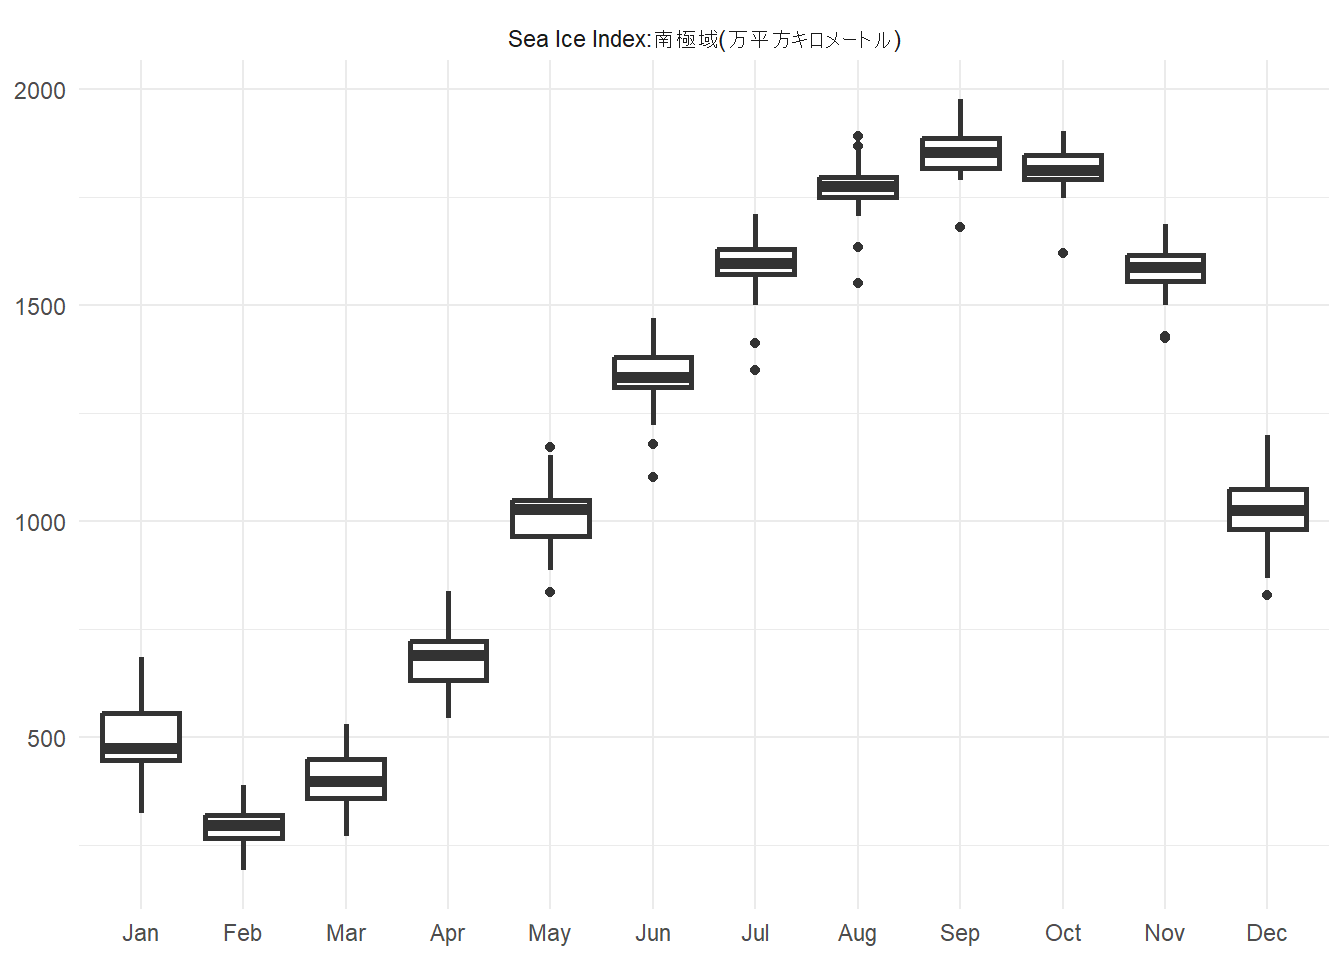
同月平均値を利用して月別箱ひげ図を描きますと(Figure 3、Figure 4)、北極域には3月を最大海氷面積、9月を最小海氷面積とする季節性が見られ、南極域には9月を最大海氷面積、2月を最小海氷面積とする季節性が確認できます。
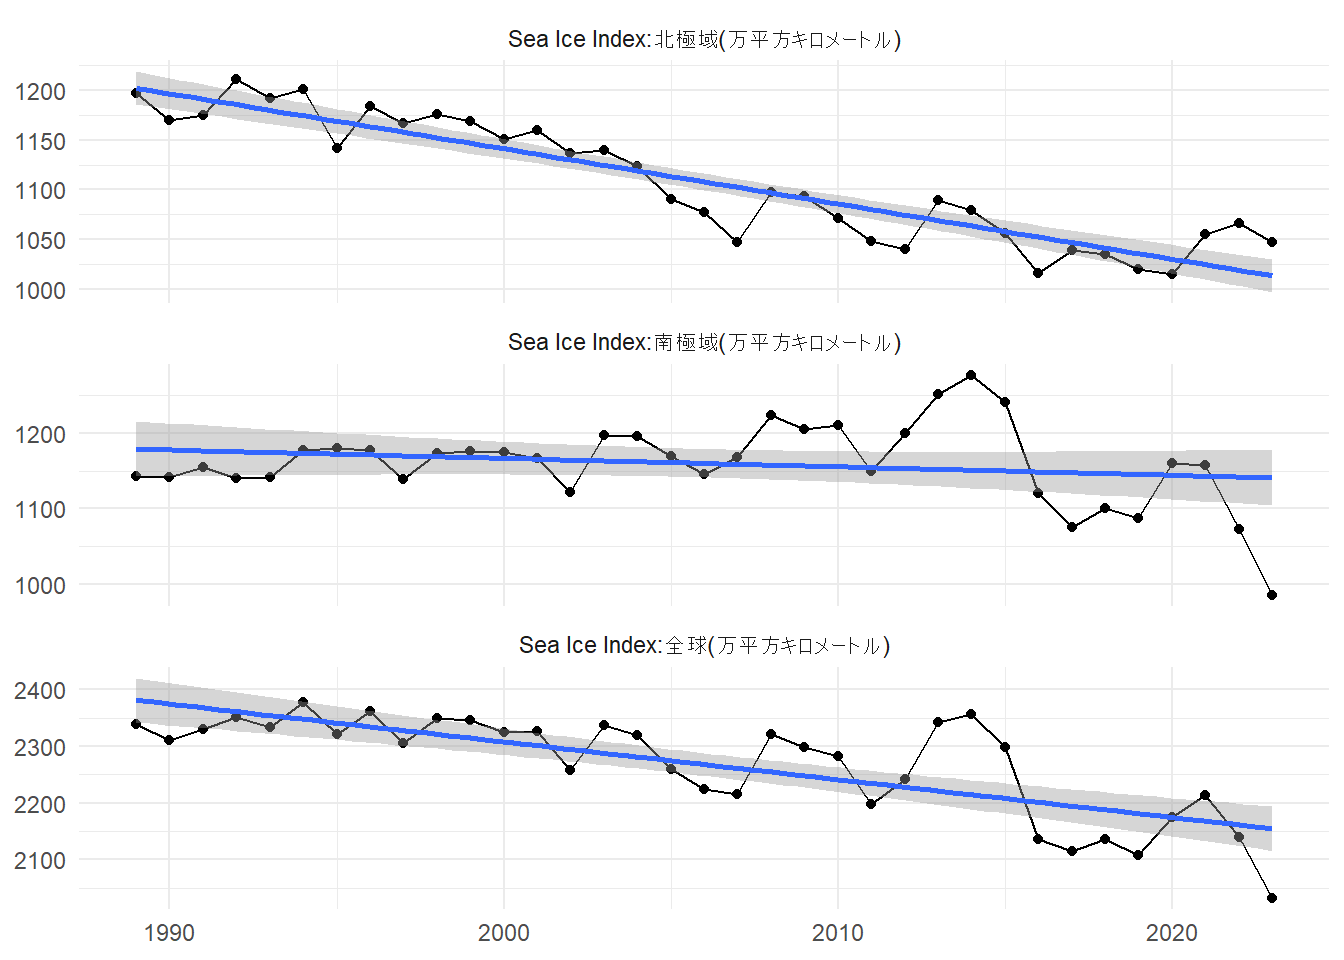
最後に日次海氷面積の年平均値の時系列推移を確認します(Figure 5、Table 3)。対象期間は 1989年から2023年までです。
Listing 1 、Listing 2、Listing 3 は北極域、南極域、全球それぞれの年次海氷面積の線形モデルです。
南半球には対象期間における有意(5%。以降同様)なトレンドは見られませんが、北半球には経時とともに海氷面積が毎年5.5万平方キロメートルずつ減少しているトレンドが見られ、結果として全球で見ますと、南極域が2022年および2023年と続けて90万平方キロメートル弱減少していることも影響して、海氷面積は毎年6.7万平方キロメートルずつの減少傾向にあることが確認できます。
| 海氷面積の年次時系列推移(直近10年分)1 | ||||
| 時間軸 | 北極域 | 南極域 | 全球 | |
|---|---|---|---|---|
1 | 2014年 | 1079 | 1278 | 2357 |
2 | 2015年 | 1057 | 1241 | 2298 |
3 | 2016年 | 1016 | 1120 | 2137 |
4 | 2017年 | 1039 | 1075 | 2114 |
5 | 2018年 | 1036 | 1100 | 2136 |
6 | 2019年 | 1020 | 1088 | 2108 |
7 | 2020年 | 1015 | 1160 | 2175 |
8 | 2021年 | 1055 | 1158 | 2213 |
9 | 2022年 | 1066 | 1073 | 2139 |
10 | 2023年 | 1047 | 985 | 2032 |
| 1 単位:万平方キロメートル | ||||
Call:
lm(formula = `Sea Ice Index:北極域(万平方キロメートル)` ~
    t)

Residuals:
    Min      1Q  Median      3Q     Max
-55.040 -16.032   1.841  20.578  46.898

Coefficients:
             Estimate Std. Error t value Pr(>|t|)
(Intercept) 1207.8428     8.3962  143.86  < 2e-16 ***
t             -5.5470     0.4068  -13.64  4.1e-15 ***
---
Signif. codes:  0 '***' 0.001 '**' 0.01 '*' 0.05 '.' 0.1 ' ' 1

Residual standard error: 24.31 on 33 degrees of freedom
Multiple R-squared:  0.8493,    Adjusted R-squared:  0.8447
F-statistic: 185.9 on 1 and 33 DF,  p-value: 4.102e-15
Call:
lm(formula = `Sea Ice Index:南極域(万平方キロメートル)` ~
    t)

Residuals:
    Min      1Q  Median      3Q     Max
-155.81  -34.31    4.76   24.63  126.45

Coefficients:
             Estimate Std. Error t value Pr(>|t|)
(Intercept) 1180.2770    18.8988  62.452   <2e-16 ***
t             -1.1199     0.9157  -1.223     0.23
---
Signif. codes:  0 '***' 0.001 '**' 0.01 '*' 0.05 '.' 0.1 ' ' 1

Residual standard error: 54.71 on 33 degrees of freedom
Multiple R-squared:  0.04337,   Adjusted R-squared:  0.01438
F-statistic: 1.496 on 1 and 33 DF,  p-value: 0.2299
Call:
lm(formula = `Sea Ice Index:全球(万平方キロメートル)` ~
    t)

Residuals:
    Min      1Q  Median      3Q     Max
-122.53  -40.45  -10.54   34.59  141.88

Coefficients:
             Estimate Std. Error t value Pr(>|t|)
(Intercept) 2388.1198    20.1196 118.696  < 2e-16 ***
t             -6.6670     0.9748  -6.839 8.35e-08 ***
---
Signif. codes:  0 '***' 0.001 '**' 0.01 '*' 0.05 '.' 0.1 ' ' 1

Residual standard error: 58.24 on 33 degrees of freedom
Multiple R-squared:  0.5863,    Adjusted R-squared:  0.5738
F-statistic: 46.78 on 1 and 33 DF,  p-value: 8.347e-08
以下は海氷面積に関連するウェブサイトです。
- https://nsidc.org/data/g02135/versions/3
- https://www.nipr.ac.jp/sea_ice/
- https://www.data.jma.go.jp/kaiyou/shindan/a_1/series_okhotsk/series_okhotsk.html
- https://www.data.jma.go.jp/kaiyou/shindan/a_1/series_arctic/series_arctic.html
- https://www.data.jma.go.jp/kaiyou/db/seaice/global_nrt/global_extent_nrt.html
- https://www.data.jma.go.jp/kaiyou/shindan/a_1/series_global/series_global.html
- https://www.data.jma.go.jp/kaiyou/db/seaice/global/global_extent.html
- https://www.data.jma.go.jp/kaiyou/db/seaice/global/globe_area.html
- https://www.data.jma.go.jp/kaiyou/db/seaice/global/global_normal.html
以上です。