Rでブルーシュ・ペイガン検定(Breusch-Pagan test)を行います。
本ページの数式、導出は以下の資料を引用参照しています。
- https://www2.kobe-u.ac.jp/~kawabat/ch03j_wooldridge.pdf
- https://www2.kobe-u.ac.jp/~kawabat/ch08j_wooldridge.pdf
以下のページも参照しています。
- https://user.keio.ac.jp/~nagakura/R/R_hetero.pdf
- https://py4etrics.github.io/14_Hetero.html
- https://www.ier.hit-u.ac.jp/~kitamura/lecture/Hit/00Statsys5.pdf
Equation 1 の不均一分散のもとでのOLS推定量を考えます。 \[y=\beta_0+\beta_1x_1+\beta_2x_2\cdots+\beta_kx_k+u,\quad\textrm{Var}(u|x)=\sigma_i^2 \tag{1}\] 分散が不均一でも決定係数(\(R^2\))の解釈は変化しません。 \[R^2\approx1-\dfrac{\sigma_u^2}{\sigma_y^2} \tag{2}\] 係数\(\beta_1\)の分散は以下の通り. \[\hat{\beta}_1=\beta_1+\dfrac{\displaystyle\sum(x_i-\bar{x})\cdot u_i}{SST_x},\quad SST_x=\sum(x_i-\bar{x})^2 \tag{3}\] \[Var\left(\hat{\beta}_1\right)=\dfrac{\displaystyle\sum(x_i-\bar{x})^2\cdot \sigma_i^2}{SST_x^2} \tag{4}\] ここで\(\sigma_i^2\neq\sigma^2\)の場合の\(\beta_1\)の分散の頑健的推論は \[Est.Var\left(\hat{\beta}_1\right)=\dfrac{\displaystyle\sum(x_i-\bar{x})^2\cdot \hat{u}_i^2}{SST_x^2},\quad\hat{u}\,\text{はOLSの残差} \tag{5}\] ブルーシュ・ペイガン検定は\(\hat{u}^2\)への\(x_1,x_2,\cdots,x_k\)の影響を検定します。 \[\begin{eqnarray}&&\hat{u}^2=\delta_o+\delta_1x_1+\cdots+\delta_kx_k+e\\&&H_0:\delta_1=\delta_2=\cdots=\delta_k=0\end{eqnarray} \tag{6}\] このとき検定統計量は以下の通り。 \[F=\dfrac{R_{\hat{u}^2}/k}{1-R_{\hat{u}^2}/(n-k-1)} \tag{7}\] \[LM(Lagrange\,\,multiplier)=n\cdot R_{\hat{u}^2}^2\sim\chi_k^2 \tag{8}\]
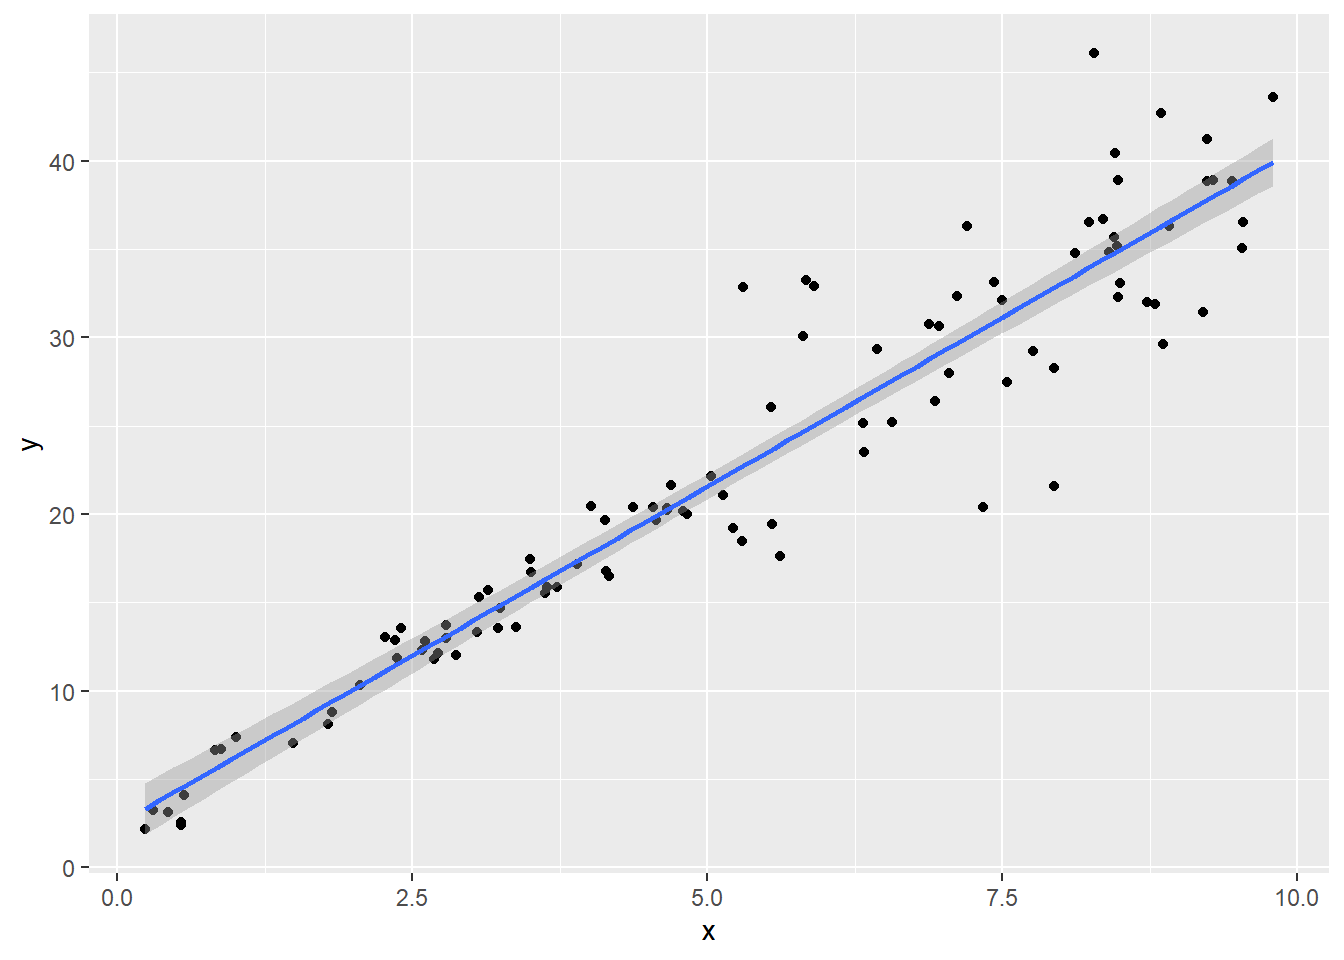
始めに誤差項(\(u\))の分散が不均一なサンプルデータを作成します。
library(dplyr)
set.seed(20250112)
n <- 100
x <- runif(n, 0, 10) %>% sort()
u <- c(rnorm(n/2, 0, 1),rnorm(n/2, 0, 5))
beta0 <- 2
beta1 <- 4
y <- beta0 + beta1 * x + u
dplyr::glimpse(data.frame(x,u,y))
Rows: 100
Columns: 3
$ x <dbl> 0.2343312, 0.3042902, 0.4300321, 0.5378495, 0.5394535, 0.5680039, 0.…
$ u <dbl> -0.74842938, 0.05792797, -0.57698180, -1.76469001, -1.60268593, -0.1…
$ y <dbl> 2.188895, 3.275089, 3.143147, 2.386708, 2.555128, 4.127015, 6.676769…分散が変化している様子です。
library(ggplot2)
ggplot(mapping = aes(x = x,y = y)) + geom_point() + geom_smooth(method = 'lm')OLSによりパラメータを推定します。不均一分散でもOLS推定量は不偏かつ一致推定量ですが、標準誤差は有効でなく、よってt検定、F検定も有効でありません。
model <- lm(y ~ x)
model %>% summary()
Call:
lm(formula = y ~ x)

Residuals:
    Min      1Q  Median      3Q     Max
-11.242  -1.466  -0.100   1.289  11.944

Coefficients:
            Estimate Std. Error t value Pr(>|t|)
(Intercept)   2.4373     0.7626   3.196  0.00188 **
x             3.8291     0.1281  29.885  < 2e-16 ***
---
Signif. codes:  0 '***' 0.001 '**' 0.01 '*' 0.05 '.' 0.1 ' ' 1

Residual standard error: 3.506 on 98 degrees of freedom
Multiple R-squared:  0.9011,    Adjusted R-squared:  0.9001
F-statistic: 893.1 on 1 and 98 DF,  p-value: < 2.2e-16
Equation 6 のモデルの下、検定統計量(Equation 8)を求めます。
# 残差
hat_u <- model$residuals

# 残差の二乗
hat_u_squared <- hat_u^2

# 決定係数
R_squared_hat_u_squared <- summary(lm(hat_u_squared ~ x))$r.squared

# 検定統計量
(test_statistic <- n * R_squared_hat_u_squared)
[1] 9.781求めた検定統計量が自由度kのカイ二乗分布に従う(Equation 8)ことを利用してp値を求めます。
# 自由度
k <- length(coef(model)) - 1

# p値
(p_value <- 1 - pchisq(test_statistic, df = k))
[1] 0.001763244「説明変数と残差は無相関」との帰無仮説は有意水準1%で棄却されます。
パッケージ lmtest の関数 bptest を利用して検定します。
library(lmtest)
bptest(model,studentize = T)
    studentized Breusch-Pagan test

data:  model
BP = 9.781, df = 1, p-value = 0.001763
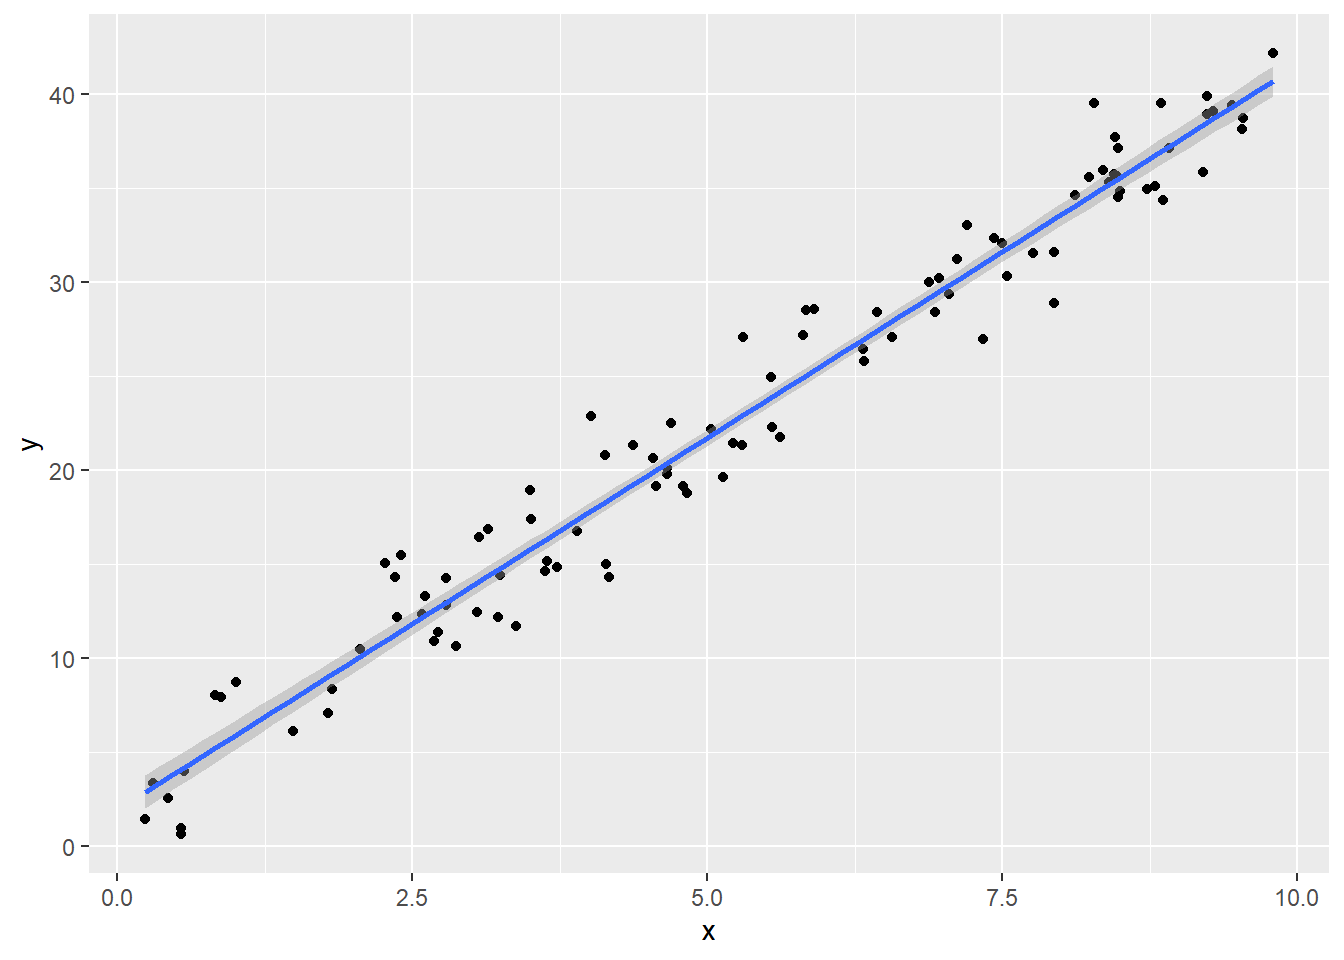
続いて分散均一のサンプルデータを作成します。
set.seed(20250112)
n <- 100
x <- runif(n, 0, 10) %>% sort()
u <- rnorm(n, 0, 2)
beta0 <- 2
beta1 <- 4
y <- beta0 + beta1 * x + u
ggplot(mapping = aes(x = x,y = y)) + geom_point() + geom_smooth(method = 'lm')検定統計量とp値を求めます。
model <- lm(y ~ x)
hat_u <- model$residuals
hat_u_squared <- hat_u^2
R_squared_hat_u_squared <- summary(lm(hat_u_squared ~ x))$r.squared
(test_statistic <- n * R_squared_hat_u_squared)
k <- length(coef(model)) - 1
(p_value <- 1 - pchisq(test_statistic, df = k))
[1] 2.180957
[1] 0.1397276「説明変数と残差は無相関」との帰無仮説は有意水準1%で棄却されません。
パッケージ lmtest の関数 bptest を利用して検定します。
bptest(model,studentize = T)
    studentized Breusch-Pagan test

data:  model
BP = 2.181, df = 1, p-value = 0.1397
以上です。


